This text is an automatic translation from Русский. It was generated by AI and may contain inaccuracies.
Read original →The New Map of Global Capital
Analysis of global foreign direct investment in 2025: FDI growth to $1.624 trillion, capital redistribution favoring developed economies, investment boom in AI and semiconductors. Ranking of recipient countries.
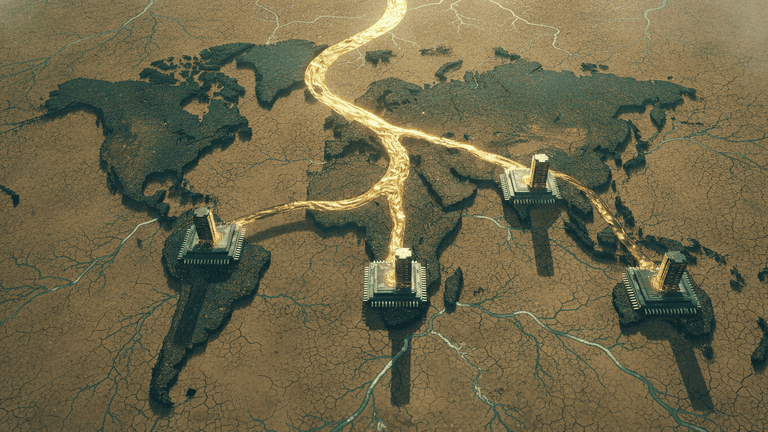
In 2025, global foreign direct investment (FDI) inflows rose by 6% to $1.624 trillion. At first glance, this suggests a recovery in international capital flows. But the number of new greenfield projects—that is, investments in building new facilities and production capacity—fell 10% over the year. So there's more money in the world, but fewer investment projects. Capital is increasingly concentrated in select countries, financial centers, and large technology projects.
Capital returns to developed economies
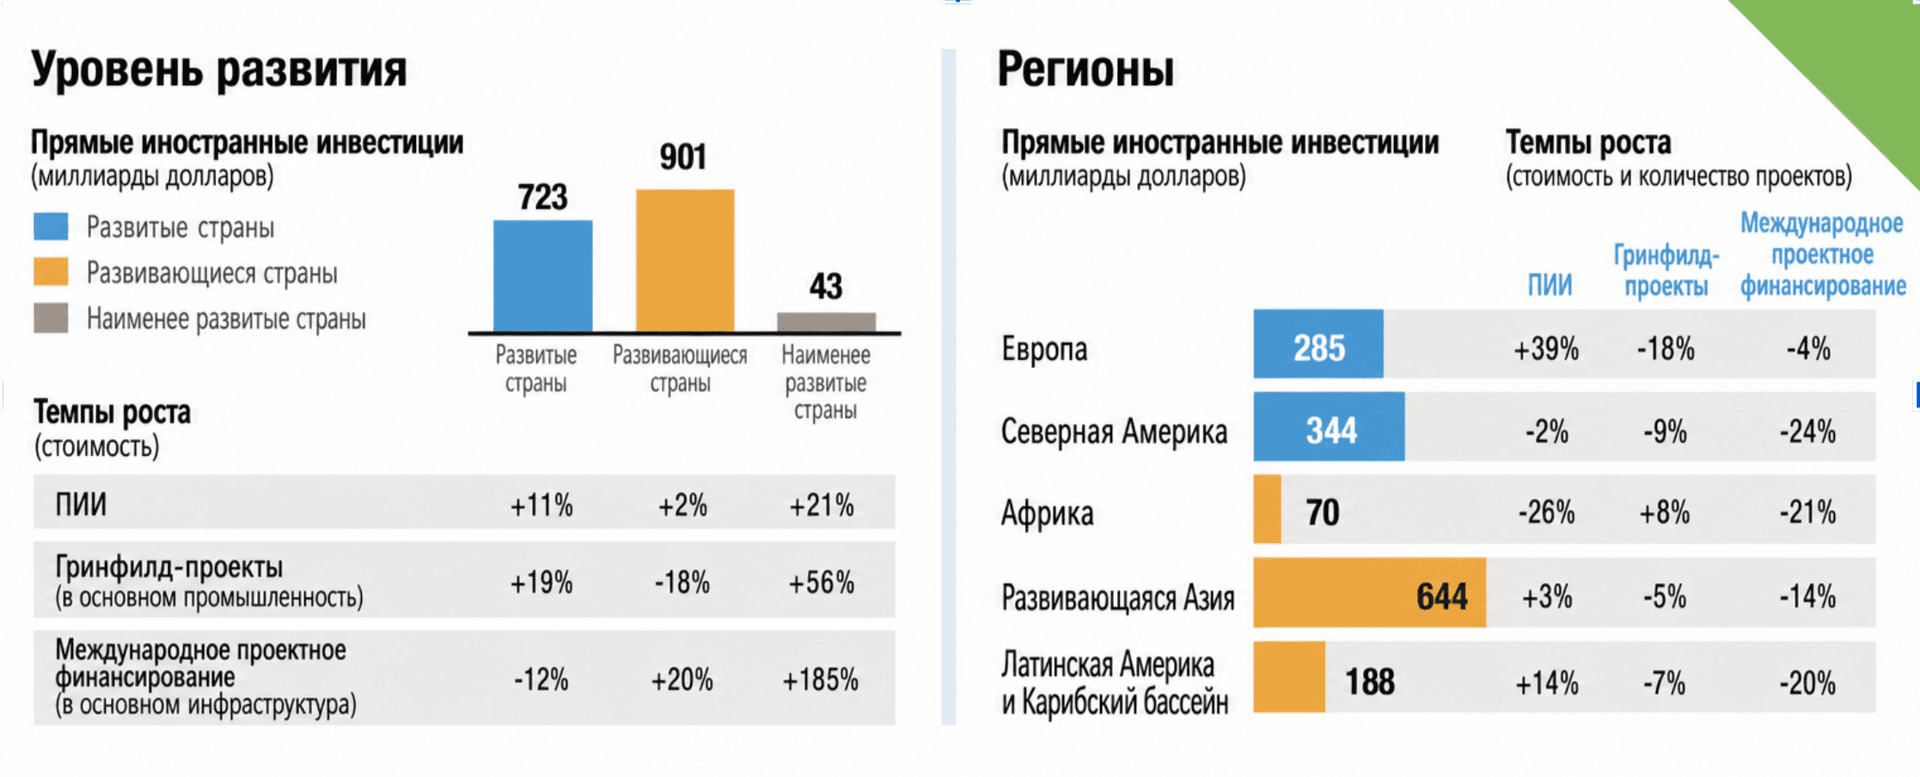
The bulk of growth in 2025 went to developed economies: they received $723 billion in FDI, 11% more than a year earlier. Developing economies received $901 billion, but their result grew by just 2%. The regional differences are particularly striking. Europe increased inflows by 39% to $285 billion, while North America saw a 2% decline to $344 billion. In Latin America and the Caribbean, the figure rose 14% to $188 billion, while in Africa it fell 26% to $70 billion.
The dynamics show that global FDI growth cannot be considered an even recovery in investment activity. Moreover, over 80% of all global inflows go to the 20 largest recipient countries. While developing economies formally receive 55% of global FDI, most of the 2025 increase went to developed countries and financial centers. For investors today, what matters is not just production costs and access to labor, but infrastructure resilience, the financial system, proximity to major markets, and the ability to control supply chains.
The U.S. maintains its lead
The U.S. remained the largest recipient of foreign investment in 2025, though inflows declined 2% to $277.3 billion. Tariff policy and uncertainty around trade conditions prompted some international companies to postpone new projects. Still, the American market continues to attract major capital: the value of announced greenfield projects rose 30%, even as their number fell by more than 10%.
Singapore took second place: inflows increased 11% to $150.9 billion. Hong Kong, by contrast, dropped to third after a 16% decline to $116.5 billion. That's its lowest level since 2022. The position of these two financial centers needs to be assessed with their specifics in mind: a significant portion of the funds passing through them is tied to cross-border and intra-group transactions. So high FDI volumes here don't always translate into a corresponding scale of new factories or production sites.
China held fourth place, but its figure fell 9% to $104.7 billion. Against a backdrop of weak domestic demand, Chinese companies themselves are more actively relocating production to other countries. One notable recipient of such capital is India: in 2025, FDI inflows there rose 44% to $39 billion. Within Asia, then, not only investment volumes are gradually shifting, but the map of production chains as well.
Europe Rose on Major Deals
The capital reallocation was particularly pronounced in Europe. The United Kingdom increased its inflows nearly fivefold over the year to $75.2 billion, while Germany saw a nearly fourfold increase to $74.3 billion. As a result, these countries claimed sixth and seventh place among the largest FDI recipients, though in 2024 they hadn't even cracked the top twenty.
These figures, however, require careful interpretation. In Germany, the growth was largely driven by major cross-border M&A deals. Notably, Denmark's DSV acquired German logistics company Schenker, while the UAE's ADNOC bought chemical company Covestro. Such transactions can dramatically alter FDI statistics in a single year, though they don't necessarily signal a mass influx of new production projects.
A similar situation is unfolding in Brazil, which took fifth place with $76.9 billion, increasing inflows by 23%. A major factor was China's ByteDance announcing a $41 billion data center construction project. But the value of an announced project and actual annual FDI flows are different metrics, so attributing Brazil's entire increase solely to this deal would be misleading.
Money Flows to Data Centers and Chips
At the same time, the sectoral structure of investment is shifting. In 2025, the value of greenfield projects worldwide grew just 1% to $1.182 trillion, even as their number fell 10%. Investment in digital infrastructure saw the most notable growth: the value of greenfield investments in this segment increased by more than 80%. Semiconductor investment rose 11%, while investment in electronics excluding chip manufacturing fell roughly 40%, automotive dropped 25%, and textiles, apparel, and leather declined about 30%.
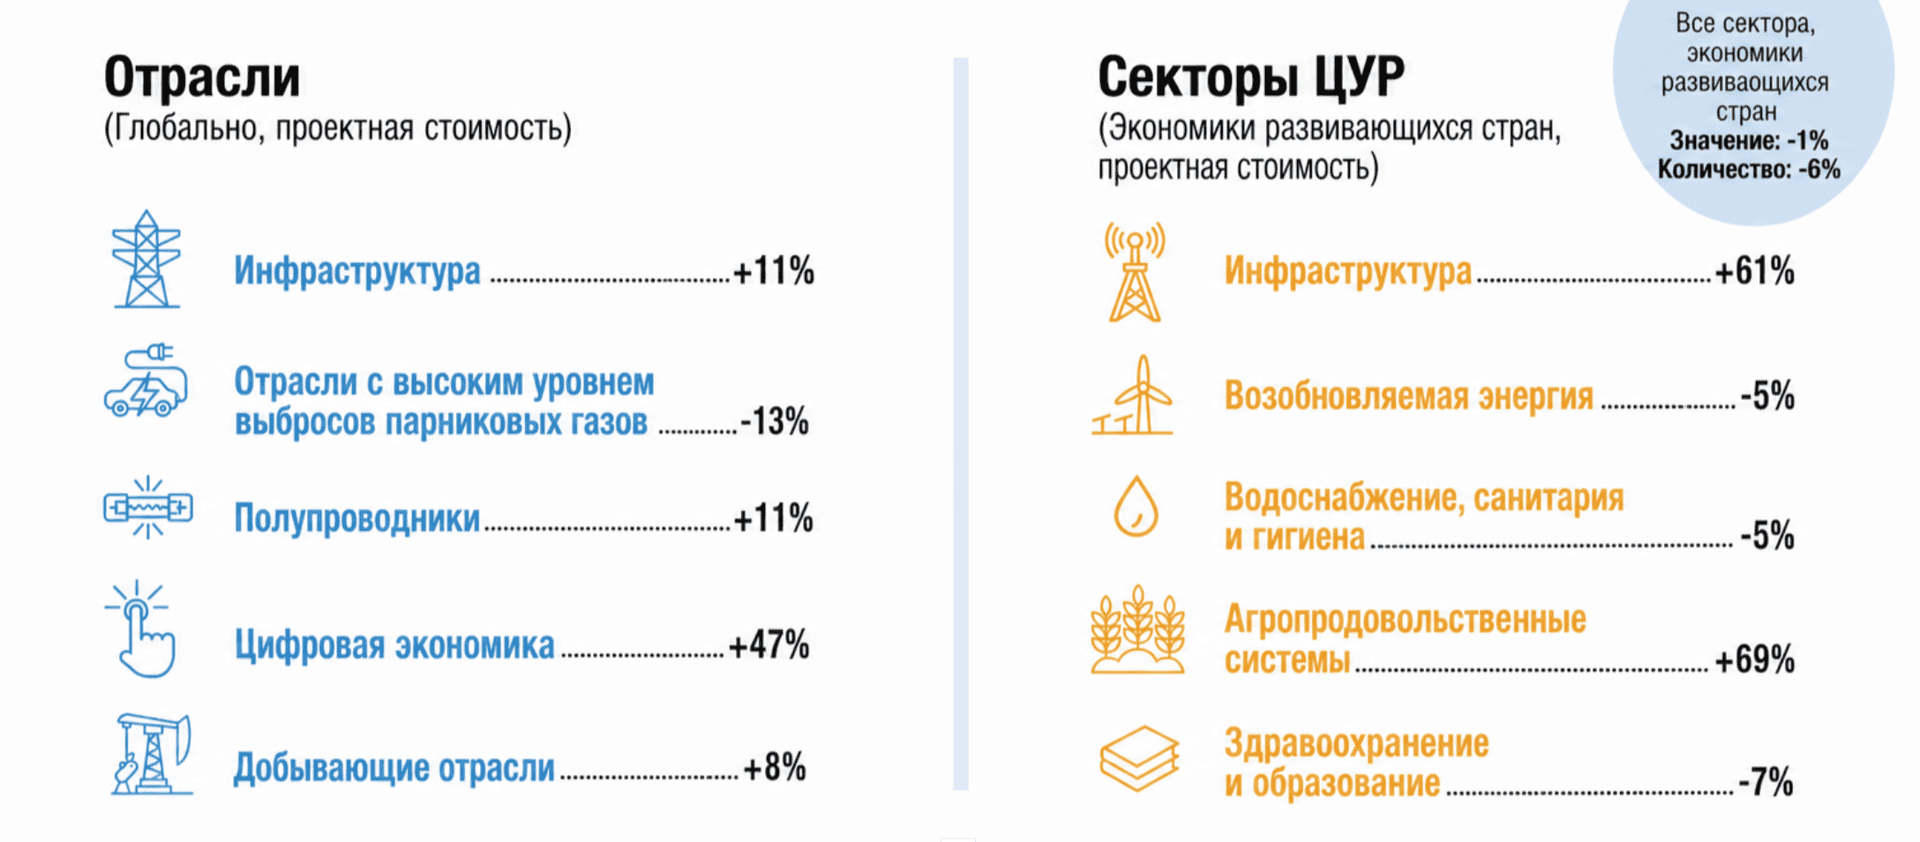
The long-term shift is even more telling. The share of strategic sectors—AI infrastructure, sensitive technologies, semiconductors, critical minerals, and energy transition technologies—in the value of greenfield projects rose from 16% in 2020 to 44% in 2025. Their volume increased from $109 billion to $576 billion. AI infrastructure and related technologies accounted for 60% of investment in these strategic sectors.
For the global economy, this represents a change in the very logic of capital allocation. International companies are no longer simply looking for the cheapest place to manufacture. Access to technology, energy and infrastructure, as well as the ability to locate production closer to end consumers, are becoming increasingly important. This explains why investment is concentrating around data centers, chips, and other industries considered critical to future supply chains.
Russia's Surge Has a Different Nature
Against this backdrop, Russian statistics look particularly unusual. According to UNCTAD data, FDI inflows to Russia in 2025 grew nearly twelvefold to $25.3 billion, lifting the country from 71st to 16th place among the largest capital recipients. Formally, this is one of the fastest growth rates in the world.
However, it would be wrong to interpret this result as a sign of foreign investors returning. UNCTAD itself attributes the surge primarily to companies reinvesting profits due to restrictions on repatriating them abroad, corporate restructuring, and other financial flows. Given the continuing restrictions and extremely limited new project activity, the figure reflects not so much the arrival of new foreign business as the movement of capital already in the country.
The Russian example is important precisely in this sense. FDI statistics combine operations with different economic substance—from establishing new enterprises to reinvested earnings and intra-group financing. This makes comparing countries solely by the volume of inward FDI increasingly difficult. To assess investors' real interest, one needs to look at the number of new projects, their sectoral structure, and the nature of the deals.
Globalization is becoming selective
In 2026, conditions for international investment remain challenging. UNCTAD expects global economic growth to slow from 3.4% in 2025 to 3.1%, while world trade growth is projected to decelerate from 5.1% to 2.8%. At the same time, the geopolitical risk index has risen from 145.1 to 230.8. This increases the cost of uncertainty for companies planning projects several years ahead.
That's why the main takeaway from 2025 isn't simply the rise in global FDI to $1.624 trillion. The very structure of capital flows is changing. Investors are becoming more cautious, reducing the number of projects and channeling more funds into select large deals, financial centers, and strategic sectors.
For countries, the competition for capital is also changing. It's no longer enough to offer investors cheap labor or a large domestic market. What matters now is supply chain stability, technological infrastructure, energy resources, and the ability to control production.