The 2026 Iran Crisis: Oil Markets, Trade Flows, and Macro-Financial Implications
Analysis of the April 2026 Iranian oil crisis: the Strait of Hormuz blockade, Brent's surge to $109 per barrel, revised forecasts of $82-134, restructuring of trade flows, Russia's role, and stagflation macro-financial risks.
11 min read
Share:
Overview
As of April 5, 2026, 38 days into the military escalation in Iran, Brent crude is trading at $109.03 per barrel—up 61.4% since February 28, 2026.
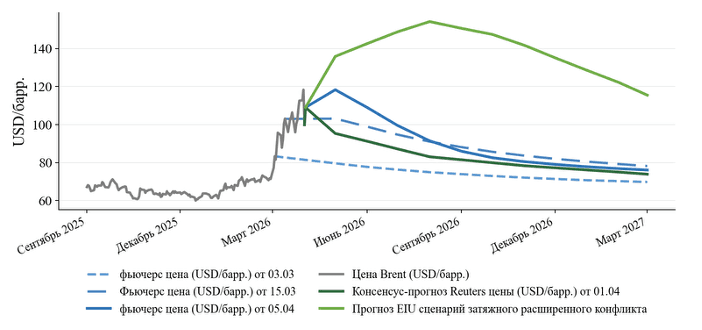
U.S. and Israeli military operations have triggered the largest disruption to global oil trade in modern history. Under normal conditions, roughly 20% of the world's oil supplies pass through the Strait of Hormuz; its blockade in the early days of the escalation was accompanied by a sharp drop in exports from Saudi Arabia, the UAE, Iraq, and Kuwait, and a substantial spike in prices. Brent climbed to around $119 per barrel, while the physical delivery price (Dated Brent) hit $141 per barrel—a record high since 2008. At the same time, volatility intensified and the futures curve shifted into pronounced backwardation.
Figure 1. Changes in Brent futures curves and forecast trajectories. Source: compiled by the author based on data from investing.com, EIU, Reuters
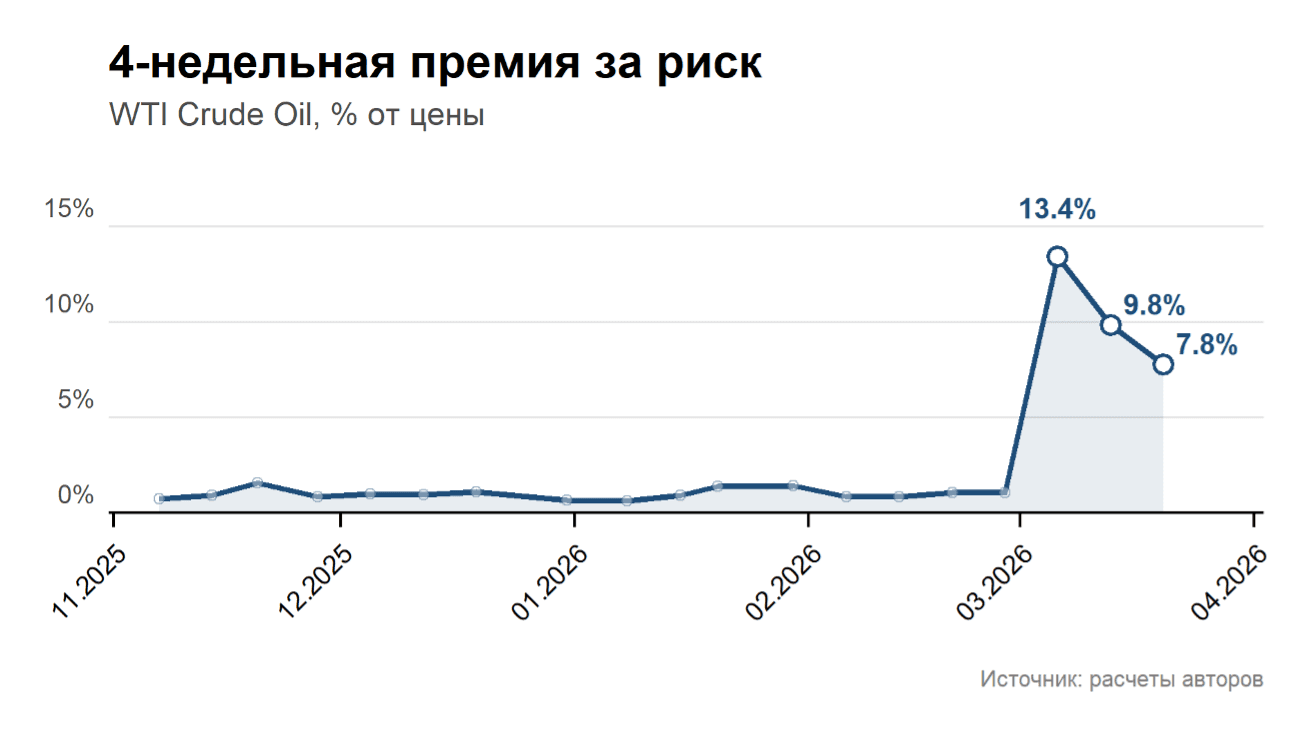
A significant factor in the price dynamics has been the substantial increase in the risk premium. During the period of greatest uncertainty in March, it reached 12–14%, before partially declining and stabilizing at 7–8%—still well above pre-conflict levels of 1–1.5%.
Compared to initial assessments, the baseline scenario has shifted upward in price level and assumes a more prolonged persistence of the risk premium. Whereas the market previously anticipated a relatively quick easing of tensions and a return to lower prices, by early April the baseline scenario envisions an elevated risk premium persisting through the second quarter, with only a gradual decline in prices as logistics and trade flows partially recover. Oil price forecasts have also been substantially revised. According to the March Reuters poll, the average Brent price for 2026 has been raised to $82.85 per barrel, up from $63.85 a month earlier.
In March 2026, the U.S. administration imposed new sanctions on vessels and companies transporting Iranian oil. At the same time, in response to the sharp price surge, the White House authorized for 30 days the use of 140 million barrels of Iranian oil already loaded. The basic mechanisms of the shock—the blockade of the Strait of Hormuz, rising insurance and logistics costs, the restructuring of trade flows, and the initial oil price reaction—were examined in detail in earlier publications. This text focuses on developments in the second half of March and early April 2026, including the shift in scenario expectations, intensifying stress in the physical market, and the broadening macrofinancial consequences.
A significant secondary effect of the crisis has been the disruption of fertilizer shipments through the Strait of Hormuz. According to FAO estimates, this has already accelerated price increases for urea and other nitrogen fertilizers; if disruptions persist, global fertilizer prices in the first half of 2026 could be 15–20% above baseline levels, raising the risk of lower crop yields and heightened food inflation.
The situation in the Iranian oil market remains highly uncertain: the conflict has amplified price volatility and complicated logistics. In the near term, if hostilities continue, Brent could exceed $120 per barrel, whereas normalization of flows could see prices return to the $70–90 per barrel range. Priority measures include monitoring negotiations, diversifying imports, and building up inventories; additional risks include renewed escalation and infrastructure damage.
Timeline of Key Events
March 14–20 — the market shifted from reacting to the military escalation to repricing the physical oil deficit; constraints in the Strait of Hormuz, rising insurance rates, and logistics disruptions became a sustained factor supporting prices.
March 24 — reports of Iran's willingness to consider the American proposal to end the war temporarily reduced the risk premium and triggered a short-term correction in oil prices.
March 26 — rising costs for physical oil delivery intensified price pressure following a spike in tanker rates from the Persian Gulf to Asia.
March 29 — the conflict's expansion to new flashpoints, including a Houthi attack on Israel, drove oil prices higher again.
March 30 — U.S. statements about the possibility of restoring control over shipping partially capped further price increases.
March 31 — upward revisions to Brent forecasts and data showing a substantial drop in OPEC production in March locked in a higher price trajectory.
April 2 — Trump's statement about intensifying strikes on Iran triggered a fresh surge in prices.
April 3 — the partial passage of individual vessels through the Strait of Hormuz somewhat reduced the near-term risk premium, but didn't alter the overall supply deficit picture.
April 4 — Iran's authorization for some vessels carrying essential goods to pass through gave a weak stabilization signal, but didn't remove the elevated geopolitical premium.
Current Assessment of Iran's Oil Market
The key feature of the current situation isn't a sharp drop in Iranian exports, but rather that Iran has maintained shipments even with the Strait of Hormuz partially blocked, while neighboring producers' exports have suffered more severely. Already in the first half of March, Iranian oil continued flowing to external markets at close to its usual pace, while deliveries from other Gulf states dropped sharply. Export continuity has been supported by the use of reflagged fleets, offshore settlement schemes, and limited insurance coverage. The main constraint, however, isn't so much the sanctions themselves as the sharp increase in insurance and logistics costs. By early April, the transit regime through the strait had been partially eased for select vessels, and on April 4, Iran authorized passage for ships carrying essential goods.
Flow Redistribution
Restrictions on passage through the Strait of Hormuz have accelerated a reconfiguration of export logistics. Some flows have shifted to alternative and backup routes: in April, shipments were recorded from the Saudi terminals Yanbu and Rabigh, which were used to bypass Strait of Hormuz restrictions; simultaneously, Iraq activated an overland route through Syria with a capacity of about 650,000 tons per month for the April–June period. Russian supplies have strengthened their position in the Asian direction: of March Russian shipments, approximately 959,000 tons went to Singapore and another 752,000 tons directly to China. Thus, market adaptation is occurring not through restoration of the previous supply configuration, but through longer routes, higher logistics costs, and a greater role for alternative suppliers. Market tightness has been particularly evident in the physical segment. By early April, Dated Brent had climbed to $141.37 per barrel, while Brent futures remained near $109–110. This points to a substantial increase in the premium for immediate delivery and tighter conditions in the physical market compared to the exchange-traded one.
Oil Products Markets
Tensions intensified in the physical oil products market, affecting both diesel and jet fuel segments. The CIF NWE diesel crack spread climbed to $57.02/bbl from $48.14 the previous week, while jet fuel CIF NWE crack reached $95.63/bbl versus $73.77, and the M1/M2 spread hit $255.23/t compared to $184.78. In Asia, the crisis manifested through declining refinery utilization rates and shrinking export flows: March diesel exports from Asia were estimated at just 3.42 million tonnes versus 5.5 million tonnes in February, while diesel exports from India fell to approximately 0.8 million tonnes. At the same time, March arrivals to Asia dropped 6.5% month-on-month to 5.56 million tonnes, even as Russian supplies surged 48% m/m to 1.85 million tonnes. This indicates that the current shock has taken on not only a crude oil dimension but also a pronounced products character: shortages of prompt delivery have intensified, price spreads have widened, and a forced restructuring of regional oil product flows has begun.
Futures Curve and Forecast Estimates
Throughout the conflict, the Brent futures curve has shifted consistently upward (see Figure 1), with backwardation strengthening. The steepest gains occurred in front-month contracts, while the far end of the curve rose more modestly. This points to growing short-term risk premium and expectations of an acute but not permanent supply deficit.
Analytical services have sharply revised their price forecasts:
Bloomberg/LSEG analyst survey (April) yielded an average for Brent 2026 of ~$134.6 (range $100–190).
EIU, projecting an average Brent price in 2026 of $94.7, with a peak around $111 in Q2; expects Brent to return to the $71–78 range in 2027–2028.
Reuters Poll: average annual Brent price for 2026 $82.85, significantly above the February forecast of $63.
J.P.Morgan/Citi: JPMorgan expects in the near term $120–130, and up to $150+ if the crisis is prolonged. Citi anticipates Brent in the second half of 2026 at $95 (base case) or $130 (crisis scenario).
The consensus of forecasts suggests that in the base case scenario, the market views the current shock as acute but not permanent; at the same time, under an adverse scenario, the risk of Brent rising to the $140–150/barrel range remains.
Risk Premium
To better understand current price dynamics, let's examine changes in the risk premium and its term structure. For this, we use the Hamilton–Wu approach, which allows us to estimate the risk premium based on current and historical futures prices. The resulting estimates show that in the pre-conflict period, the 4-week risk premium stood at 1–1.5%, but in early March, amid heightened uncertainty, it surged to 13.4%, before declining to 7.8% (Figure 2).
Figure 2. Dynamics of 4-week risk premium in the oil market
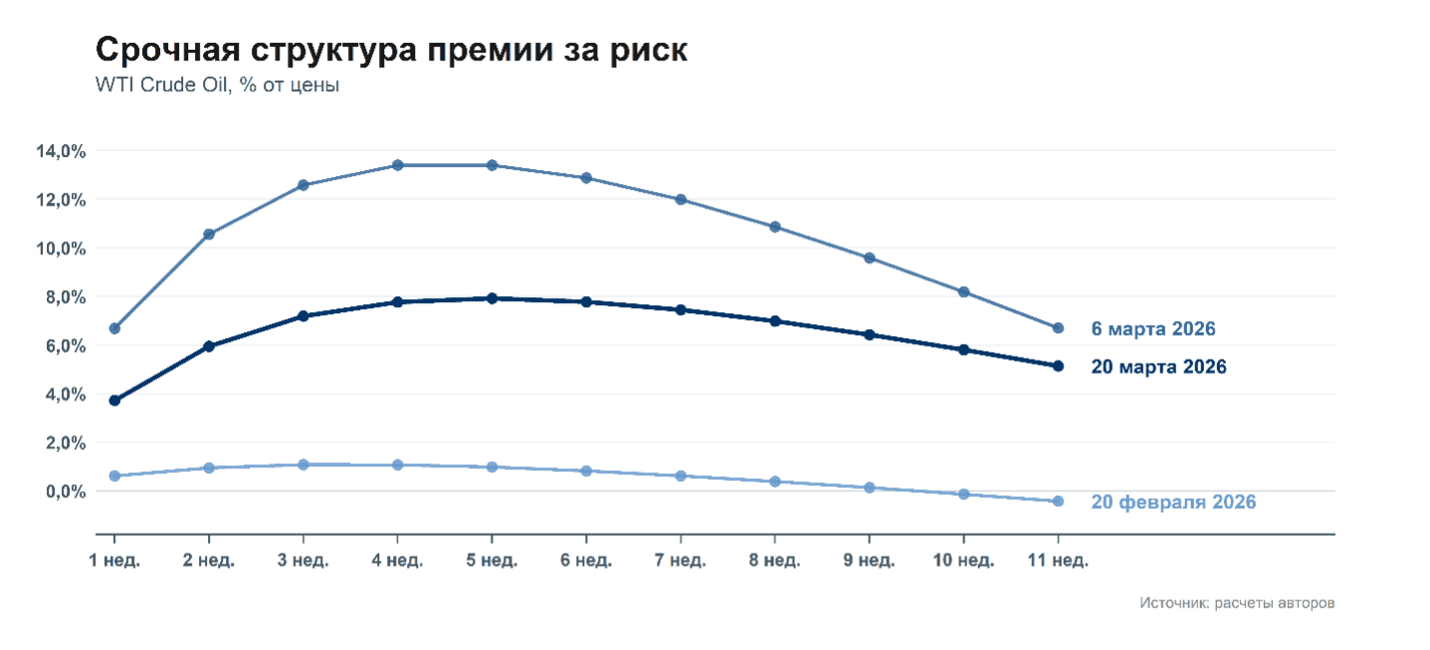
Figure 3 presents the term structure of the risk premium in the Brent oil market for three dates—February 20, March 6, and March 20, 2026. In the pre-conflict period, the curve (February 20) remains virtually flat and close to zero (around 1%), consistent with a balanced market state. At the peak of the crisis on March 6, the premium spikes sharply, reaching a maximum of around 13–14% at the 4–5 week horizon. By March 20, the premium declines noticeably to around 7–8%, but retains a pronounced "hump-shaped" form, reflecting the concentration of risks in the near-term horizon.
Figure 3. Term structure of risk premium in the oil market
Transmission Channels to the Global Economy
The consequences of the current crisis extend beyond the oil market. The primary transmission channel is linked to higher prices for oil, LNG, maritime logistics, and related industrial costs, which intensifies inflationary pressure and worsens terms of trade for energy-importing countries. At the same time, transportation, chemical feedstocks, and fertilizers become more expensive; this increases the likelihood of reduced fertilizer application, deteriorating crop yields, and accelerating food inflation in the second half of the year. The EIU explicitly notes that among the most vulnerable segments are fertilizers, aviation, energy-intensive industries, and global supply chains.
Financial Markets
The crisis is already exerting a noticeable impact on macro-financial conditions. The EIU notes that by March 20, European equity markets had fallen roughly 10% from February 26, the broad U.S. market by around 6%, and global bond yields had risen by more than 30 basis points. This trend persisted through the end of March: according to Reuters, global government bonds posted their largest monthly decline in several years amid mounting stagflation fears; the yield on 2-year U.S. Treasuries rose by approximately 50 basis points in March, while short-term yields in the United Kingdom and Italy climbed by more than 80 basis points. The market is thus pricing in not only higher inflation but also a tighter monetary policy trajectory.
Equity Markets
The stock market reaction has been uneven. Overall, rising energy prices are weighing on the broader market through pressure on costs, inflation, and interest rates, yet the energy sector has emerged as a relative beneficiary. Reuters noted as early as March 20 that oil's surge of more than 40% over three weeks was one of the key factors pressuring U.S. equities overall. At the same time, in early April, amid a fresh wave of escalation, shares of oil and gas companies rose alongside crude: according to market reports, Exxon Mobil and Chevron gained around 3–3.4% in a single day, and the sector ETF XLE rose about 2.9% following Trump's statements on intensifying strikes against Iran. Thus, in the current configuration, the shock is redistributing market capitalization in favor of energy producers while simultaneously undermining sectors sensitive to fuel, transportation, and interest rate costs.
Russia's Outlook
In the near term, Russia is among the external beneficiaries of the crisis, as Asian importers are rapidly replacing lost volumes from the Persian Gulf with alternative supplies. This has been most evident in India: in March, Russian oil deliveries rose to 1.97 million barrels per day from 1.04 million b/d in February, with Russia's share of Indian imports reaching around 44%. That said, the positive effect is constrained by persistent discounts on Russian grades, sanctions restrictions, logistical bottlenecks, and export revenue volatility. According to Bloomberg estimates, even before the April price surge, Russia's oil tax revenues in March were nearly half the level of a year earlier. Thus, the current crisis reinforces Russia's role as a supplier to Asia but does not radically alter its position in the global market.
Scenario Forecasts
In the baseline scenario, the acute phase of the conflict is time-limited, and partial restoration of shipping through the Strait of Hormuz begins before the end of Q2. The EIU estimates Brent will reach around $111/barrel in Q2, then decline to approximately $87/barrel by year-end; the average price for 2026 is $94.7/barrel.
In the event of prolonged disruptions in the Strait of Hormuz and persistent infrastructure and insurance constraints, the market remains in a state of physical deficit. The EIU estimates that of the roughly 20 million barrels per day normally passing through the strait, a significant portion remains blocked, already leading to a reduction of around 6.5 million b/d in production and about 2 million b/d in refined product output. In this case, Brent could hold above $100/barrel, with consequences manifesting in higher inflation, slower growth, and tighter financial conditions.
In the event of a protracted and broader regional war with an effective blockade of the Strait of Hormuz persisting through much of 2026, the EIU allows for the global economy to shift into a stagflationary regime. In such a scenario, oil prices could reach $200/barrel and remain above $100/barrel even beyond 2026. Additional deteriorating factors include damage to energy infrastructure, prolonged capacity outages, reduced fertilizer production, and intensified food inflation.
Medium-term horizon. The EIU estimates that after the acute phase passes, Brent will trade in the $71–78/barrel range in 2027–2028. This suggests the market views the current shock as acute but not as a new permanent price level.
Critical factors include the duration of the Strait of Hormuz blockade, the scale of infrastructure damage, the resilience of insurance and freight markets, the speed at which reserves are depleted, and the degree to which third countries become involved in the conflict.