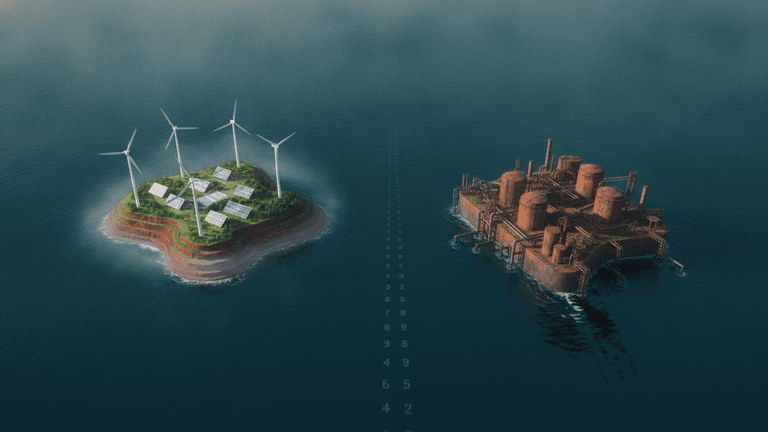
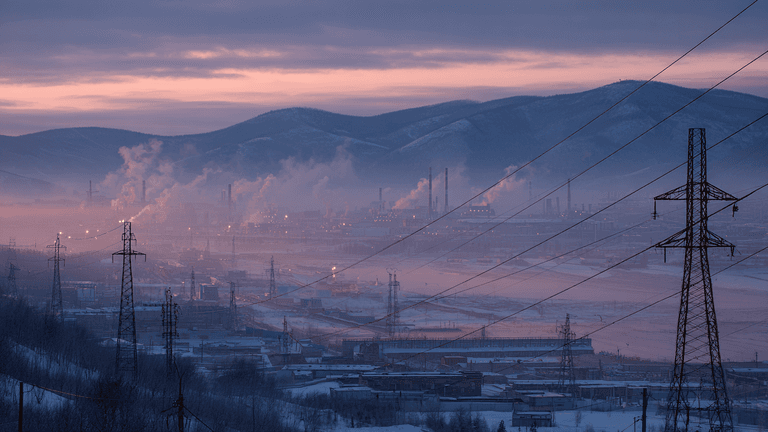
As global oil prices retreat from the peaks driven by geopolitical conflicts, the world's two largest emerging economies face fundamentally different energy challenges. Brazil is seeking ways to further develop a power system already dominated by renewable energy sources, while Russia confronts a strategic choice: accelerate the transition to a more diversified energy model or continue postponing this process, maintaining its dependence on oil and gas revenues. The outcomes of the energy summit in Rio de Janeiro provide a window into Brazil's current situation and illuminate what this comparison reveals.
Dispatches from the ground: observations from the Rio energy summit
At the late-May energy summit in Rio de Janeiro, two meetings with industry specialists revealed what typically remains hidden behind the statistics. Representatives from BRVAL, a company operating in the electricity sector, agreed on one point: the state consistently supports the industry's development, and this support doesn't depend on the current political climate.
According to them, the main difficulties aren't related to government policy itself, but to its practical implementation. Bureaucratic procedures and high tax burdens slow the rollout of new projects and increase their costs, but don't call into question the industry's overall development trajectory. For analysis purposes, this is fundamentally important: it's one thing to have a market where the state's strategy remains stable but execution challenges arise, and quite another to face a situation where government policy itself constantly shifts. These scenarios require different approaches to industry development, and the level of investment risk differs substantially.
Fabio Monteiro, director of the Brazilian Energy Storage Association (ABSAE), highlighted three key points.
- First, the Brazilian government is gradually moving away from the role of passive regulator and beginning to actively shape the market—including through special auctions for energy storage projects.
- Second, in his assessment, there are no substantial political risks to the continuation of these measures across government transitions. This conclusion aligns with the broader trajectory that has taken shape in Brazil's renewable energy sector since the early 2000s, dating back to the PROINFA program (a program to stimulate alternative energy sources in Brazil, launched in 2002), which has maintained continuity regardless of political cycles.
- Third, Brazil today operates more as a country that implements technologies than as a supplier of them. It attracts cutting-edge solutions through government procurement and by drawing attention from foreign technology companies, but hasn't yet become a player capable of exporting its own developments at scale and competitively. This distinction matters and directly affects the comparison with Russia that follows below.
Regarding challenges related to power system development, Monteiro notes: such difficulties aren't unique to Brazil. California, Germany, and China have faced similar "growing pains." The key difference between successful adaptation and prolonged structural losses lies in how quickly and effectively authorities respond to emerging disruptions.
Structural divergence: resource base, LCOE economics, and diverging trajectories
Brazil's renewable electricity share in 2024 stood at 88.2%, still underpinned primarily by large hydroelectric plants. But the more important trend lies elsewhere: growth is no longer coming from hydro. Wind and solar provided 24% of electricity generation in 2024 (up from 9.9% in 2019), and in August 2025 their share exceeded 34% for the first time in history.
In 2024, Brazil planned to commission 10.9 GW of new capacity—the highest figure since records began in 1997. Notably, 91% of new additions came from wind and solar.
By comparison, Russia's installed wind and solar capacity stands at around 2.5 GW, accounting for approximately 0.5% of total electricity generation in 2025 (of which 0.4% is wind and 0.1% is solar), while thermal plants account for 60-65%. Forecasts suggest that by 2035, Russia's renewable energy capacity could grow to 18.4 GW at an average annual growth rate of around 6.5%.
This would represent a notable increase in relative terms, but within a system that will remain predominantly hydrocarbon-based generation for the foreseeable future.
This isn't simply a comparison between a "leader" and a "laggard." Both countries find themselves at the same juncture—facing declining hydrocarbon prices, global pressure related to the low-carbon transition, and budget constraints. But they've arrived here from entirely different starting conditions and with different internal incentives to respond.
The reason Brazil's transition to renewable energy is developing primarily through market forces, while Russia requires active government participation, is largely tied to the cost of electricity production.
In Brazil, competitive auctions held since 2011 have reduced the levelized cost of electricity (LCOE) for onshore wind farms by approximately 40% in real terms over twelve years. This has been made possible by several factors. First, the country's northeast is home to some of the world's best wind zones, with capacity factors of 40–50% compared to a global average of around 25%. Second, economies of scale have played a role—Brazil has built one of the world's most active auction markets for renewable energy. Third, the structure of the power system itself matters: large hydroelectric plants effectively function as seasonal energy storage, smoothing out fluctuations in wind and solar output.
Russia operates under a different model—the DPM-RES program, which includes equipment manufacturing localization requirements. This is a deliberate industrial policy compromise: priority is given to developing domestic production rather than purchasing the cheapest technologies on the global market. As a result, electricity costs turn out higher than they would under fully competitive international procurement—a direct consequence of the chosen strategy.
An additional factor is geography. The best sites for wind and solar generation in Russia are far from major consumption centers, which increases transmission costs. In Brazil, this problem is partially mitigated by a well-developed interregional transmission corridor running from the northeast to the southeast.
More broadly, this asymmetry is explained by what's known as the "resource abundance effect," described by van der Ploeg and Venables. The essence is that countries with rich resource bases tend to postpone structural transformations: current resource revenues simultaneously support consumption levels and reduce pressure for rapid reforms.
Brazil's electricity curtailment problem: a global perspective
In 2025, Brazil curtailed approximately 20% of potential wind and solar generation. This resulted in economic losses of around 6.5 billion Brazilian reais (approximately $1.23 billion). In the period from January to April 2026, the figure worsened, reaching 17.2% compared to 15.3% for the same period a year earlier.
According to forecasts by the National System Operator (ONS), by 2029 up to 96% of such curtailments will be driven not by insufficient grid capacity, but by systemic generation surplus—when production exceeds demand (ONS, curtailment forecast, 2025).
This is an important distinction. Grid congestion requires expansion and modernization of transmission lines. Generation surplus, however, is a matter of energy storage and demand management. In response to this situation, Brazil is simultaneously developing both directions—expanding grid infrastructure and deploying energy storage and flexible demand management solutions, trying to adapt its tools to the changing nature of the problem.
As Monteiro noted at the summit, this is not a Brazilian anomaly. Table 2 places this in an international context.
These figures cannot be directly compared across countries. Brazil's 20.6% reflects the total volume of potential wind and solar generation curtailment, while Germany's 4–8% range refers to a specific grid corridor, and California's data pertains to solar generation overall. A cross-country study by ScienceDirect (December 2025) confirms that this directional rather than direct comparison is the correct approach.
Three key conclusions follow from this. First, the scale of curtailment in Brazil indicates not system failure, but that generation development is outpacing infrastructure development. Second, California's experience shows that deploying energy storage can significantly reduce such curtailment within 3–5 years. Third, models focused predominantly on grid expansion (as in Germany and China's early development period) prove slower and more costly compared to approaches that combine grid development, energy storage, and demand flexibility.
There's also an important technical distinction for Brazilian energy policy. California's so-called "duck curve" (a graph that vividly illustrates the grid balancing problem with high solar penetration) stems from excess solar generation at midday, which is relatively easy to offset with batteries offering around four hours of duration. Brazil's situation is different: curtailment is primarily linked to wind generation concentrated in the country's northeast. Peak output there occurs during nighttime hours and the dry season (July–November), which conversely coincides with the inverse seasonal dynamics of hydroelectric reservoir levels. This makes such energy systemically valuable, but temporarily "misaligned" with consumption.
To fully utilize the northeast's excess wind energy requires either storage systems with duration exceeding four hours, or flexible demand mechanisms—for example, electrolysis for "green" hydrogen production as a controllable load.
ANEEL's energy storage auction (2 GW with four-hour duration) partially addresses this challenge, but long-duration storage technologies remain underdeveloped. Plans to build 15,000 km of transmission lines (approximately $10.5–11 billion, 2028–2030) and an 89% increase in battery component imports in 2023–2024 (RatedPower) show that private investment is already outpacing the emergence of clear regulatory frameworks.
Falling oil prices and the calculus of renewable energy investment
The drop in oil prices linked to supply normalization under the U.S.-Iran agreement examined in the fourth column of this series affects renewable energy development differently in each country.
For Brazil, this effect is indirect. State oil company Petrobras, which now participates in renewable energy projects (including receiving preliminary approval for a 24.5 MW offshore wind pilot project off the coast of Rio de Janeiro; potential scale—up to 14.5 GW jointly with Equinor), faces increased pressure on capital expenditures due to declining oil revenues. This may slow offshore wind development, but simultaneously strengthens incentives for gradual capital reallocation toward clean energy. Meanwhile, onshore wind and solar generation remain largely insulated from oil price fluctuations and continue developing along their own trajectory.
In Russia, the impact is more direct. As noted in the fourth column, the 2025 budget constraints have already led to spending cuts of approximately 200 billion rubles in areas such as technology, aviation, robotics, and industrial programs. These are sectors that lie outside core defense funding and are critically important for the long-term diversification of the economy.
Long-term contracts under Russia's DPM-RES program provide relative stability for renewable energy projects already underway. However, the pace of new auctions, the stringency of equipment localization requirements, and the Ministry of Energy's ability to attract foreign technology partners remain sensitive to the overall budget situation.
The oil price cycle affects renewable energy development differently in the two countries. For Brazil, it is more of a secondary factor in an already-launched structural transition. For Russia, it remains a key condition that determines the very dynamics of the transition at an early stage of its formation. Falling oil prices intensify the long-term strategic necessity of renewable energy investments in Russia, but simultaneously reduce the budgetary capacity to implement them. This is essentially a contemporary manifestation of the so-called "resource curse" (Sachs and Warner, 1995; Van der Ploeg and Venables, 2011).
Strategic Complementarity: What Brazil and Russia Can Offer Each Other
Table 3 highlights five areas of complementarity. The most applied among them is regulatory framework. The experience of Brazil's ANEEL agency, which has been conducting competitive energy auctions for 25 years and is now extending this mechanism to energy storage systems and offshore wind power, largely addresses the challenges that Russia is tackling within the second phase of its DPM-RES program.
The BRICS energy research platform plays a distinct role here, creating institutional conditions for exchanging such practices without the need to build separate bilateral negotiation mechanisms.
In hydrogen energy, the two countries complement rather than compete with each other. Brazilian Law No. 14948/2024 supports green hydrogen production from solar and wind at the Pecém complex in Ceará state. Russia's strategy, meanwhile, focuses on blue hydrogen (from natural gas with carbon capture and storage) and turquoise hydrogen (methane pyrolysis).
That said, an important clarification: Russia currently has virtually no operational industrial carbon capture and storage capacity, so blue hydrogen remains more of a medium-term goal than an immediate commercial direction. Similarly, turquoise hydrogen globally is still at the pilot project stage. In Brazil, the timeline for green hydrogen project implementation also runs into years.
Overall, both directions should be viewed as long-term strategic positioning for future BRICS export markets (India, China, South Africa), once the relevant technology chains reach industrial maturity. This is not about near-term trade flows, but about market formation over the long haul.
The third aspect of complementarity is purely technical in nature and relates to power system management. It is based on the seasonal "inverse relationship" between hydropower and wind generation.
In Brazil, peak wind energy production in the northeast occurs during the dry season (July–November)—precisely when water levels in hydroelectric reservoirs reach their annual lows. This inverse seasonality effectively turns the reservoir system into an energy storage mechanism for months ahead, enabling output smoothing on a scale that no battery technology can currently match.
In Russia, the system operator is already facing growing challenges in integrating renewable energy sources: by 2035, installed wind capacity could exceed 10 GW, and balancing tasks will become increasingly similar in structure. From this perspective, the operational management approaches used in Brazil may be applicable to other power systems as well.
As Monteiro noted at the summit, Brazil's role in this interaction consists primarily of adopting technologies through interstate cooperation mechanisms. Essentially, this model could also be used by Russia—through the institutional framework of BRICS, where the exchange of technical solutions is less dependent on political disagreements.
Conclusion: Different Problems, Common Horizon
Both countries are undergoing real energy transformations, but they are at different stages and starting positions—this is not so much a "leader–laggard" hierarchy as different development trajectories.
Brazil has become one of the major economies to relatively quickly increase its share of renewable energy without introducing carbon pricing. This was facilitated by high-quality natural resources, a competitive auction system, and natural reliance on hydropower. Current challenges—generation constraints, insufficient storage capacity, and transmission bottlenecks—are essentially "growing pains." Meanwhile, a set of solutions designed for the next 3–5 years is already taking shape.
In Russia, the transition is at an earlier stage not due to lack of political will—the RES DPM mechanism has been in place since 2013—but because of a different incentive structure. Abundant domestic gas reduces short-term pressure for accelerated power system transformation, while localization requirements shift the focus toward developing the industrial base rather than maximizing the pace of technology deployment. As a result, both models can be viewed as rational solutions arising from different conditions but with long-term structural consequences.
Falling oil prices, on one hand, strengthen the long-term strategic necessity for Russia to invest in renewable energy, but on the other hand, narrow the budgetary capacity to implement them.
Whether Russia's stated target of 18.4 GW of installed capacity by 2035 becomes the foundation for a sustainable structural transition will largely depend on maintaining investment consistency throughout the entire budget cycle.
The complementarity matrix presented in Table 3 shows that the BRICS format can be viewed as an underutilized cooperation channel—for transferring regulatory approaches, coordinating hydrogen strategies, and exchanging experience in power system management. Through this institutional framework, both countries can address different types of challenges while relying on common technical and organizational infrastructure that is largely insulated from geopolitical tensions.