This text is an automatic translation from Русский. It was generated by AI and may contain inaccuracies.
Read original →Russia and UAE Oil Economies: A Comparative Analysis of Key Development Indicators
A comparative analysis of economic indicators for Russia and the UAE: GDP, oil production and exports, energy consumption. Comparing absolute and relative metrics of two oil-dependent economies.
The Scale of Two Economies
This article compares key economic indicators of the fuel and energy sectors in Russia and the UAE. The interest in such a comparison stems from the fact that both countries rely heavily on hydrocarbon extraction and exports and play significant roles in the global energy market.
The material examines GDP by purchasing power parity, oil production and exports, electricity consumption, and population size. It also analyzes how much energy resources the countries consume for domestic needs and how much they allocate to electricity generation. Some indicators are compared over time from 1991 to the present.
In absolute terms, Russia significantly outpaces the UAE. However, when calculated per capita, the situation changes: by several metrics, the UAE notably surpasses Russia. This is largely explained by the difference in scale between the two countries. Russia has a much larger population, considerably more territory, and more dispersed economic centers. All of this affects the volume of oil and gas revenues, as well as the distribution of budget funds across different levels.
Russia and the UAE occupy important positions in the global oil market and possess substantial hydrocarbon reserves, making the oil and gas sector highly significant for both economies. At the same time, differences in territorial size, climate, geographic location, and economic structure determine different development models for each.
Directly comparing the investment opportunities of Russia and the UAE isn't entirely appropriate. The Russian economy possesses considerable potential that extends beyond the oil and gas sector. This creates opportunities for further growth and development along its own economic path.
The UAE is located in Southwest Asia, in the eastern part of the Arabian Peninsula. The country ranks among the world's ten largest states by oil production and exports. Oil and natural gas remain the foundation of the UAE economy and account for a significant portion of GDP.
The UAE economy is the second largest in the Middle East after Saudi Arabia. Meanwhile, the country's government is actively investing in developing other sectors, seeking to diversify the economy and reduce dependence on oil and gas revenues. One result of this policy has been rapid tourism growth: today the UAE is one of the largest tourist centers in the Middle East, and tourism has become one of the main sources of non-oil revenue for the country.
Russia also plays an important role in the global oil and natural gas market and maintains close economic ties with the UAE in trade, investment, energy, and finance. Both countries also cooperate within the OPEC+ framework. Therefore, comparing the level of economic development between Russia and the UAE is quite commonly used in business circles.
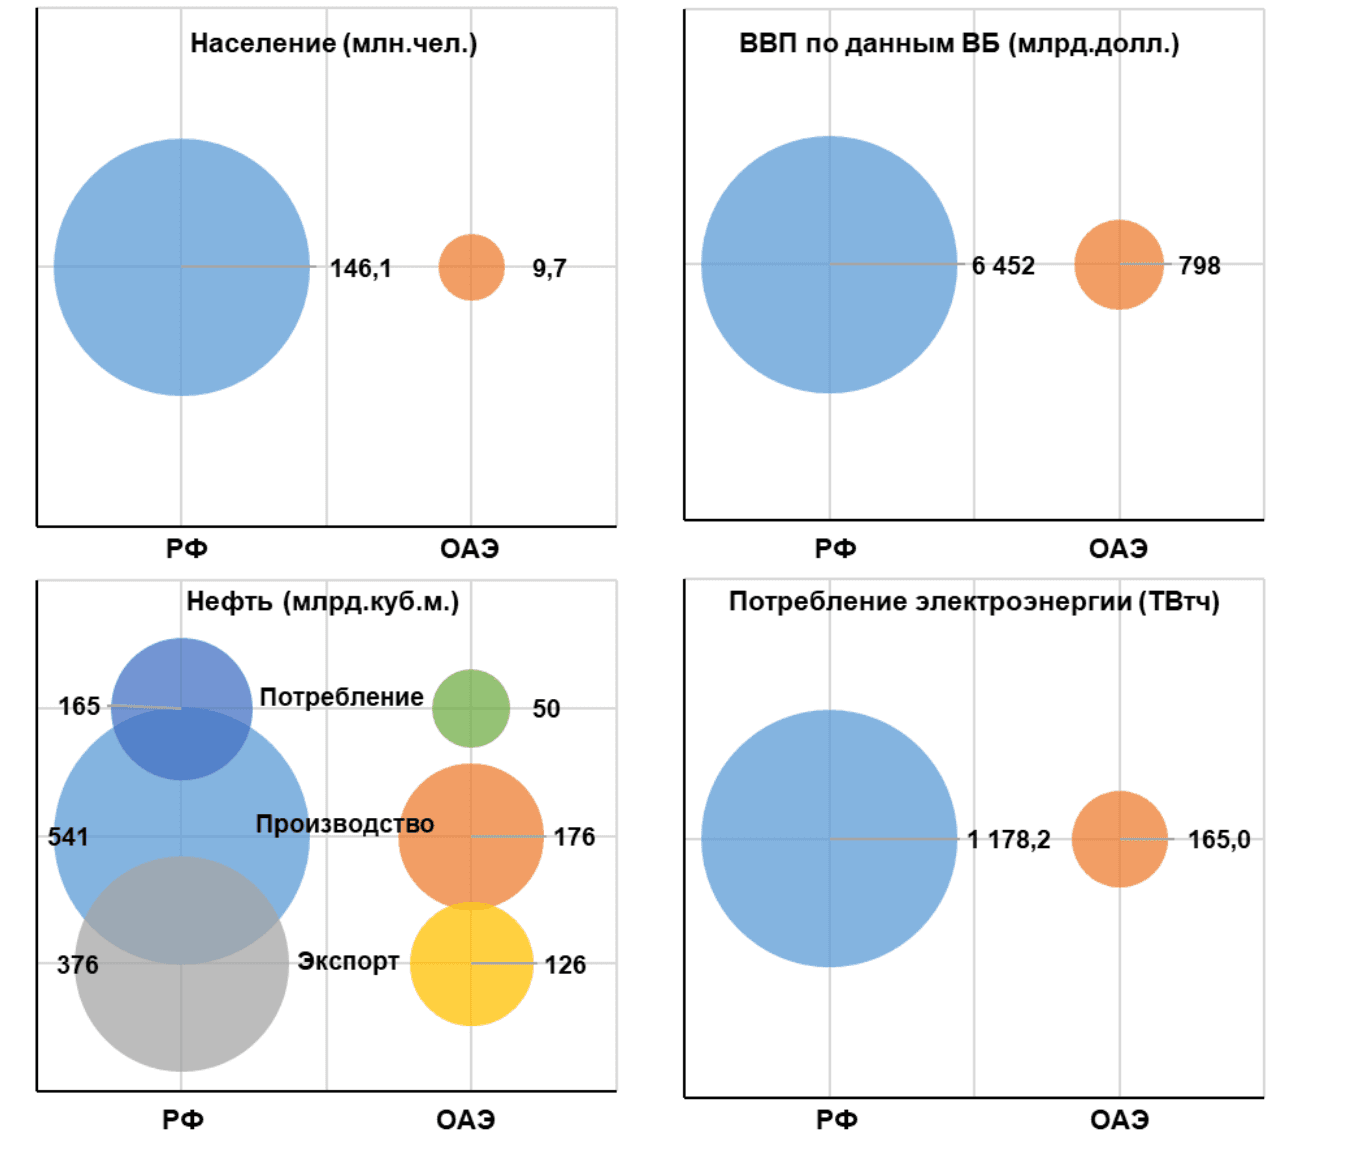
Figure 1 presents charts comparing certain absolute indicators for Russia and the UAE for 2024. The UAE population stands at 9.7 million people—approximately 15 times smaller than Russia's. Meanwhile, the UAE's GDP totals $798 billion per year, which is 8 times less than Russia's figure.
In oil production, the UAE lags behind Russia by approximately 3 times. Russia also exceeds the UAE by more than 3 times in oil consumption and exports. The gap in electricity consumption is even larger: Russia's figure is approximately 7 times higher.
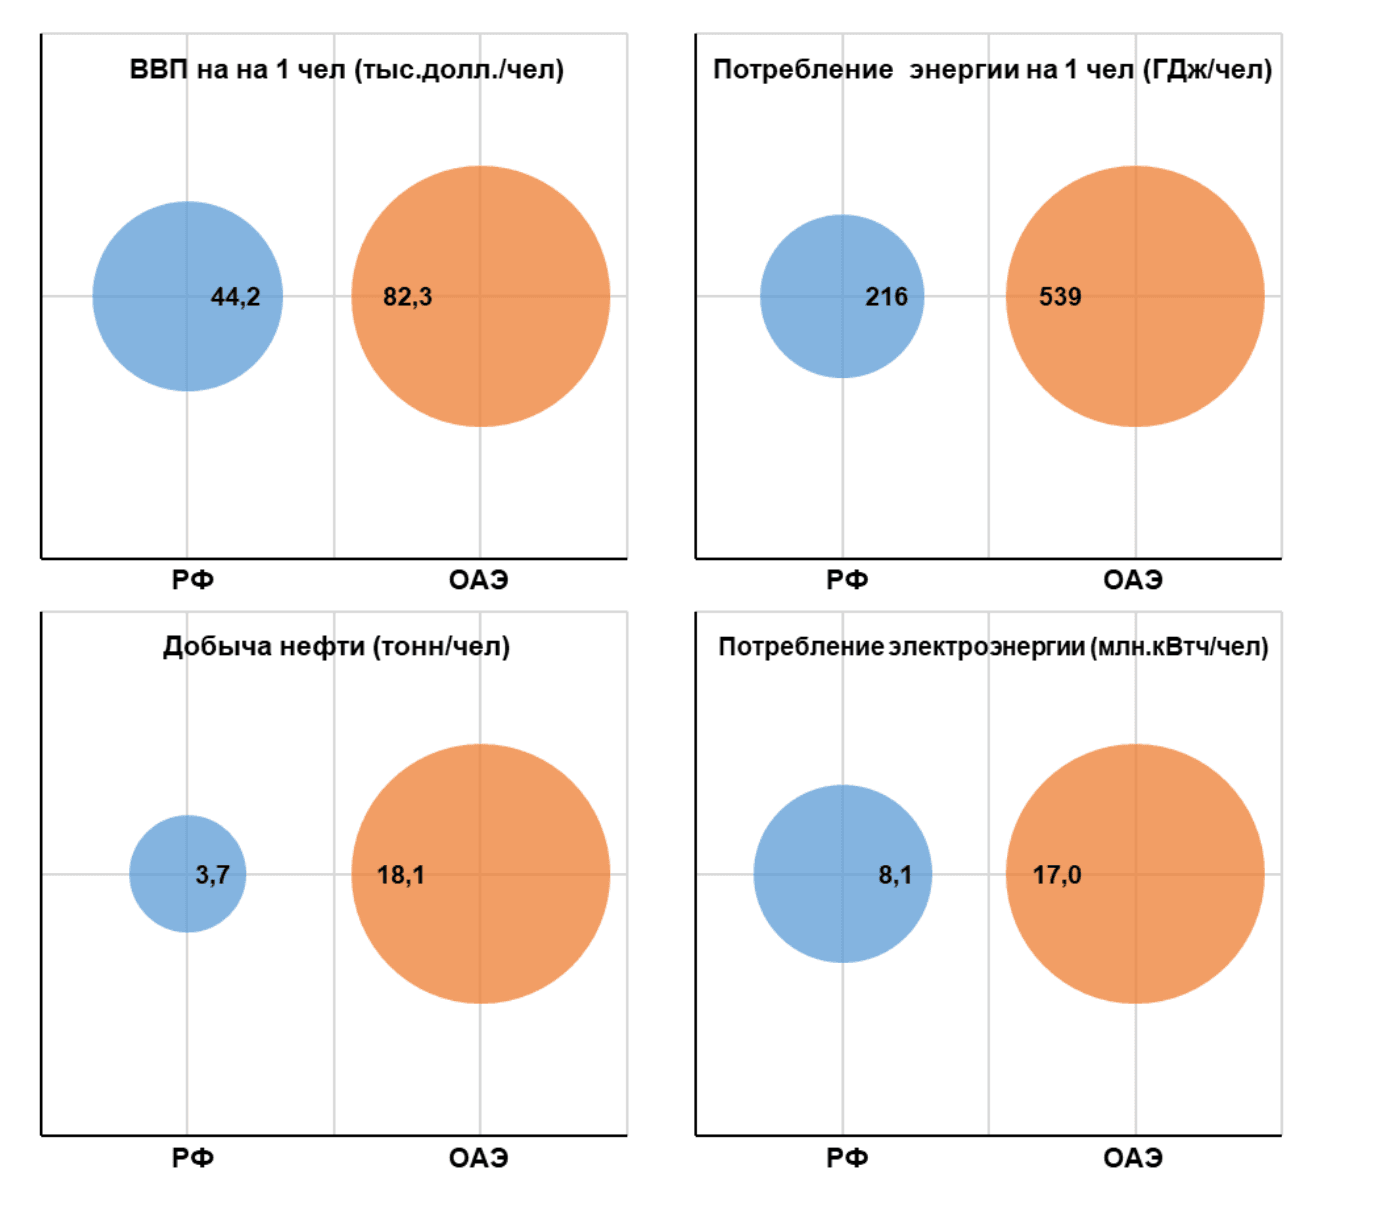
Figure 2 provides a comparison of relative indicators for Russia and the UAE for 2024. When the data is recalculated per capita, the picture changes. GDP per capita in the UAE is nearly 2 times higher than Russia's figure. Energy consumption per person is also significantly higher—approximately 2.5 times.
Different Energy Models
Comparing absolute and relative indicators for Russia and the UAE yields several conclusions.
- In absolute terms, Russia leads the UAE by more than 3 times in oil production and consumption. However, on a per capita basis, the situation is reversed: Russia's oil production per person is 4.8 times lower than the UAE's. This shows just how dramatically different the relative scales of oil production are between the two countries, and why directly comparing their indicators based solely on total volumes is misleading.
- The gap in oil exports per capita is even more pronounced. In Russia, this figure stands at 2,500 cubic meters per person, while in the UAE it reaches 13,000 cubic meters. Thus, per capita oil exports in the UAE are roughly 5 times higher than Russia's.
- Russia surpasses the UAE by 7 times in total electricity consumption. But when population is factored in, the picture changes: per capita electricity consumption in the UAE is more than twice that of Russia. High per capita electricity consumption can indicate the level of industrial development, transportation infrastructure, and the prevalence of home automation systems.
- Russia and the UAE are both among the world's major oil producers and exporters. However, on a per capita basis, the UAE leads Russia in production and export volumes by more than 5 times. This partly explains the differences in the countries' oil export revenues and their capacity to channel oil and gas income into economic investment.
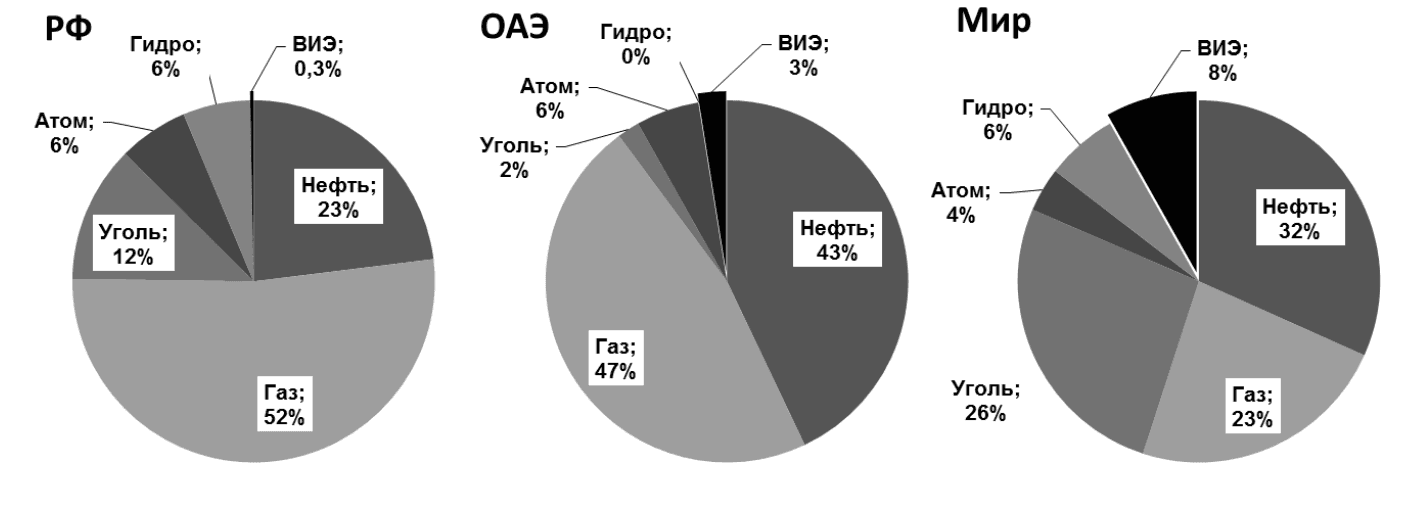
Figures 3 and 4 present data on the structure of primary energy consumption, as well as energy resources used for electricity generation in Russia, the UAE, and globally in 2024.
Natural gas dominates the primary energy consumption structure in both countries: accounting for 52% in Russia and 47% in the UAE. This differs markedly from the global average: natural gas represents 53% of global primary energy consumption—roughly half the share seen in Russia and the UAE. Meanwhile, oil's share of primary energy consumption in the UAE reaches 43%, substantially higher than in the comparison countries and globally.
In electricity generation, natural gas remains the primary fuel source in the UAE, accounting for 72%. In Russia, its share is 45%, while the global average is 23%. Notably, the UAE does not use coal for power generation, whereas in Russia it accounts for 18%, and globally 35%.
The share of renewable energy sources in the UAE stands at 8%, compared to 1% in Russia. This reflects the global trend toward renewable energy development and gradual reduction of dependence on hydrocarbon fuels.
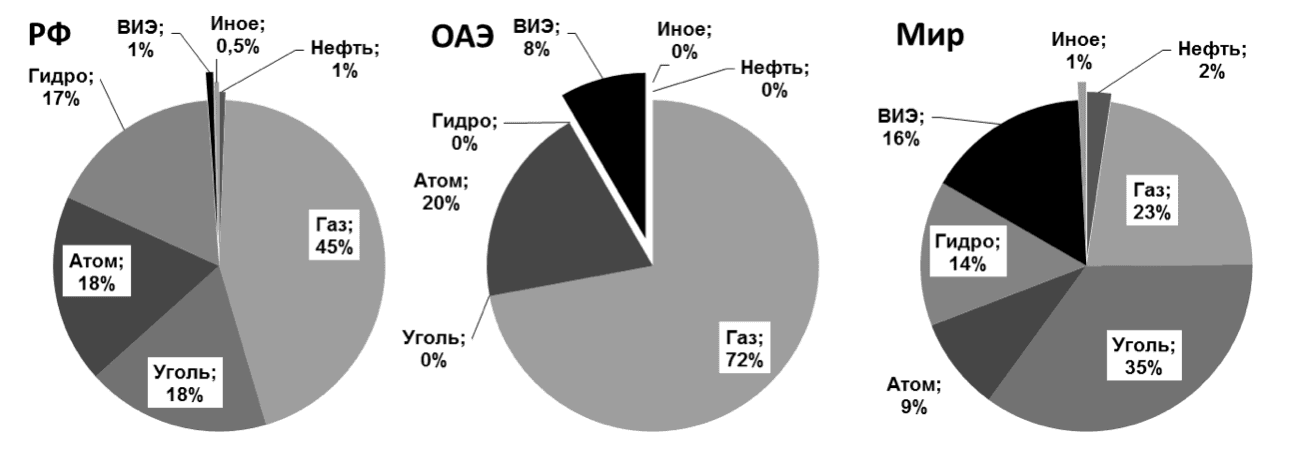
Comparing energy consumption structures shows that despite substantial hydrocarbon exports, the UAE is actively developing renewable electricity generation. Against the backdrop of high per capita electricity consumption, this indicates significant national investment in energy technologies.
Figure 5 presents the dynamics of selected economic indicators for Russia and the UAE from 1991 to 2024. In the UAE, notable growth in PPP GDP, primary energy consumption, and electricity generation began after the 2000s. Over this period, PPP GDP grew more than 5-fold, primary energy consumption more than 3.5-fold, and electricity generation more than 8-fold. Natural gas consumption and oil production also increased over the 33 years, though less dramatically.
In Russia over the same period, oil production has shown the most consistent growth—increasing 1.5-fold. Growth in other indicators, including PPP GDP and electricity generation, is largely tied to the economy's recovery from the 1990s crisis.
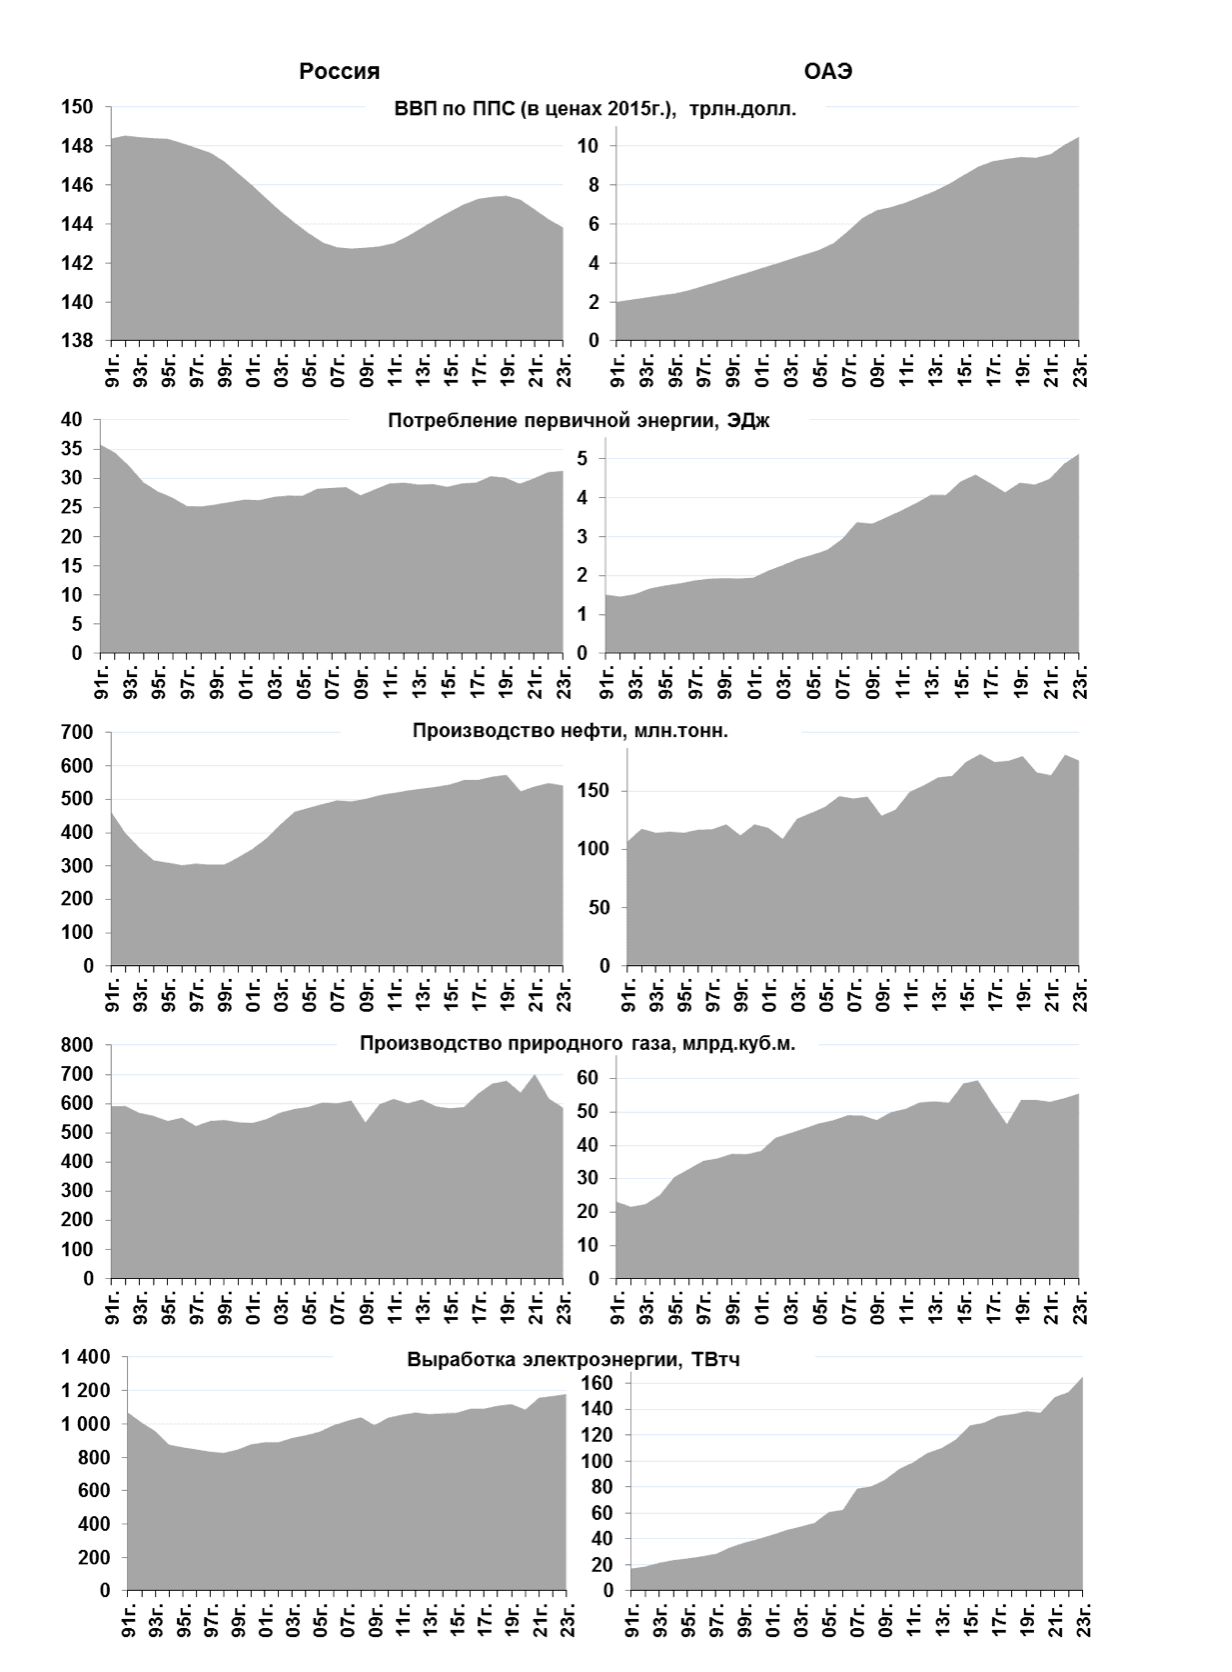
Analysis of economic development trends in Russia and the UAE shows that over the past 25 years, the UAE economy has grown substantially. In certain key sectors, growth has exceeded eight-fold—for instance, electricity generation increased more than 8 times.
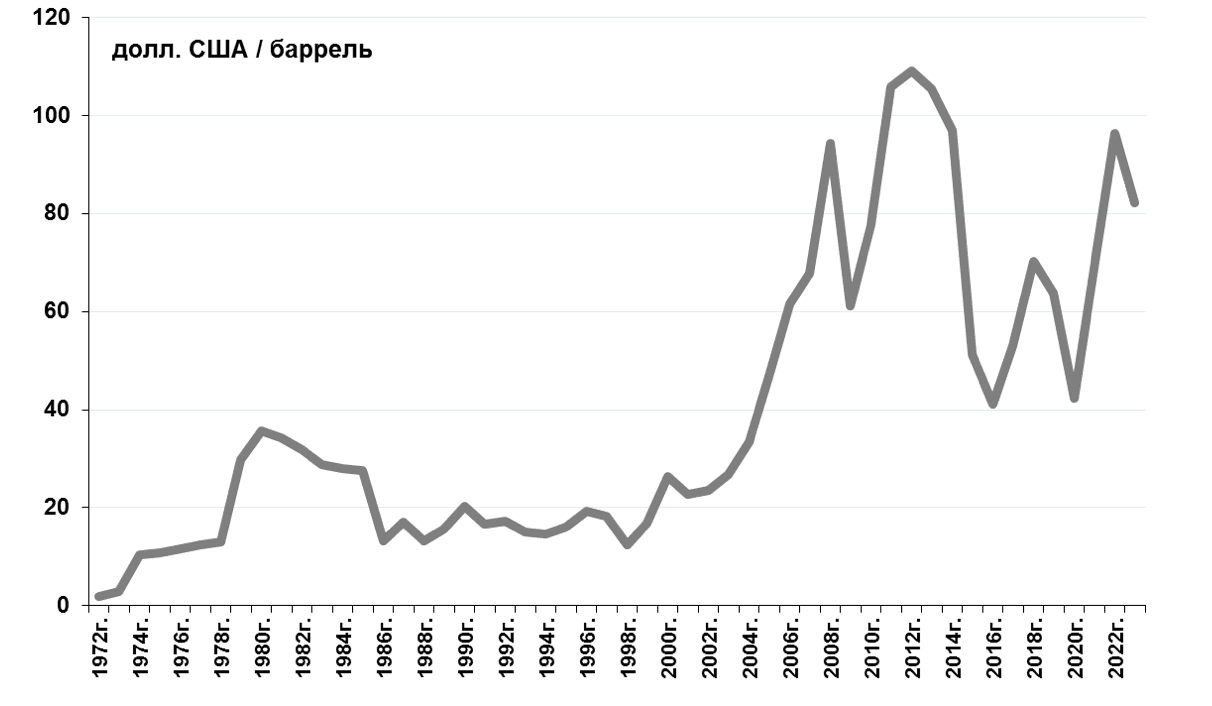
This rapid growth in the UAE economy is primarily linked to active development of oil and gas fields and rising global oil prices since the mid-2000s (Figure 7). These two factors became the main drivers of the country's economic growth. For Russia, rising oil prices during the same period also became an important factor in economic recovery, though its impact proved less significant than in the UAE.
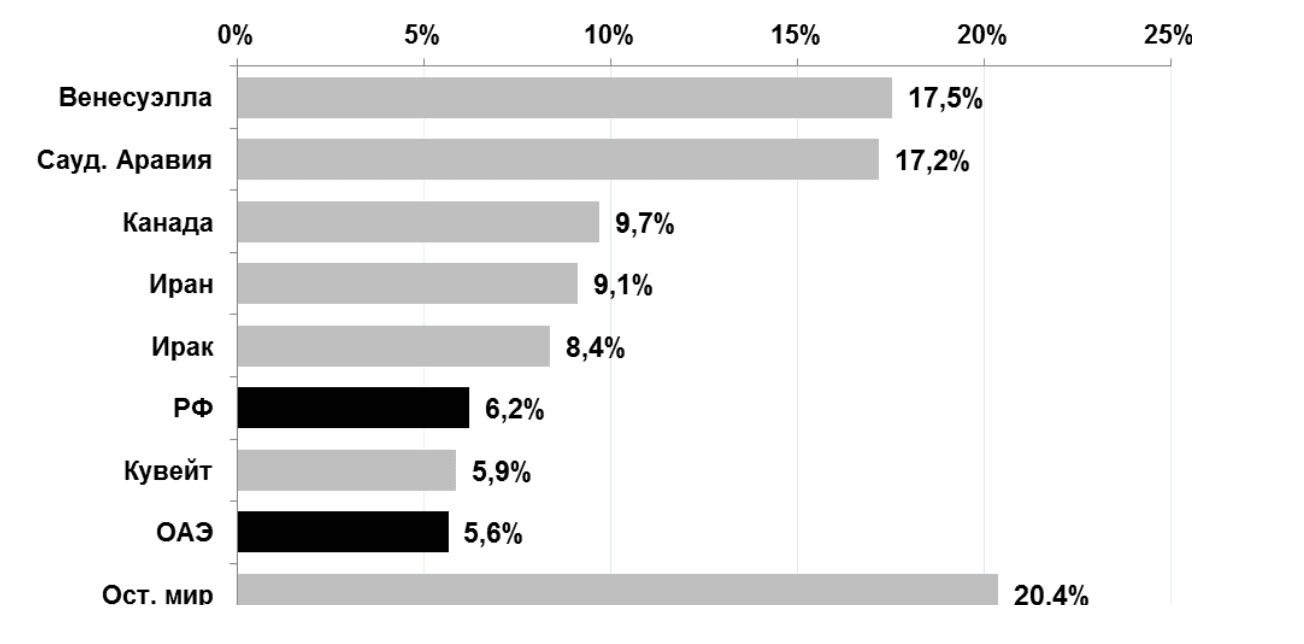
Overall, Russia and the UAE hold comparable positions in terms of global oil reserves. Figure 6 presents data on the ten countries with the largest oil reserves in 2024. Russia accounts for 6.2% of global reserves, while the UAE holds 5.6%. Both countries trail Venezuela (17.5%), Saudi Arabia (17.2%), Canada (9.7%), and other major reserve holders. Thus, neither Russia nor the UAE ranks among the world leaders in oil reserves.
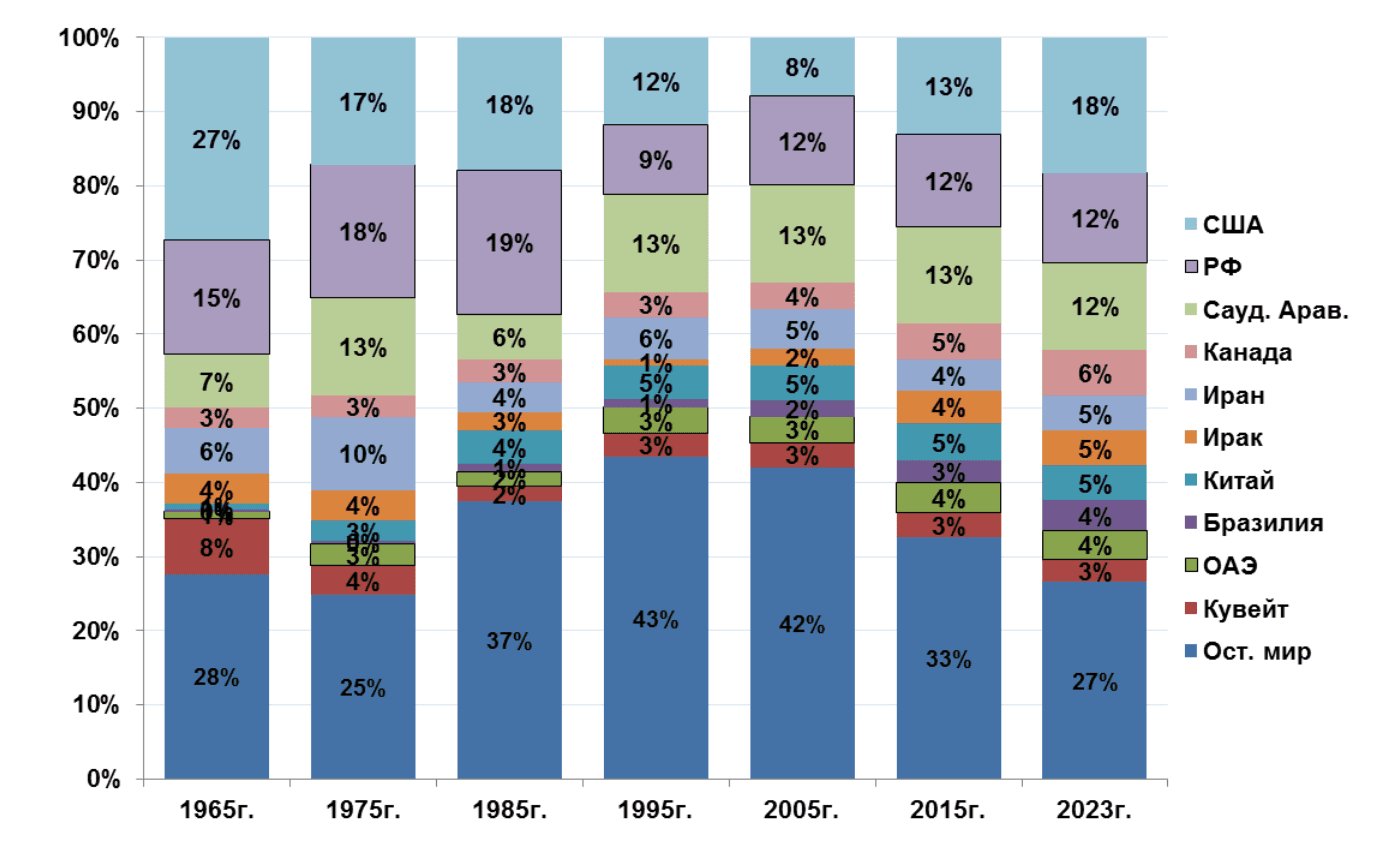
Figure 10 shows the structure of global oil production among the ten largest countries in 2023 and in previous decades. Russia ranks among the top three oil producers in the world, while the UAE holds 9th place. That said, the UAE's production volumes remain significant on a global scale and ensure the country plays a notable role in certain regional markets.
Key Research Findings
- Russia and the UAE play important roles in the global oil and natural gas market. The countries have close economic ties across various sectors, which is why they're often compared in terms of hydrocarbon exports and investment opportunities. Yet despite the apparent similarities between their oil and gas economies, Russia and the UAE differ substantially in scale.
- In absolute terms—PPP GDP, oil production and exports, electricity consumption—Russia significantly outpaces the UAE. But on a per capita basis, the situation reverses: by several measures, Russia notably lags behind the UAE. The main reason is the difference in scale between the countries. Russia has a much larger population, considerably more territory, and more dispersed economic centers. This affects both the volume of oil and gas revenues and the distribution of budget resources across different levels.
- The differences are especially pronounced in per capita electricity consumption. This indicator reflects the different levels of technological and economic development between the two countries. The structure of energy consumption also differs, including how energy resources are used for electricity generation. This is influenced by the specifics of each economy, territory, geographic distribution of production, and other factors. As a result, Russia and the UAE are developing along different energy and economic models.
- Russia and the UAE occupy important positions in the global oil market, making the oil and gas sector a significant part of both countries' economies. At the same time, differences in scale, climate and geography, as well as economic structure, shape different development paths. Directly comparing the investment potential of Russia and the UAE is difficult: the UAE economy only gained particularly active momentum in the early 2000s. Meanwhile, the Russian economy has significant potential that extends beyond the oil and gas sector and creates opportunities for further independent development.
Reprinted from the journal Industrial Policy in the Russian Federation. 2026. No. 1-3. pp. 15-24. Comparative Analysis of Fuel and Energy Complex Industries of the Russian Federation and the United Arab Emirates / Dzyuba A.P.