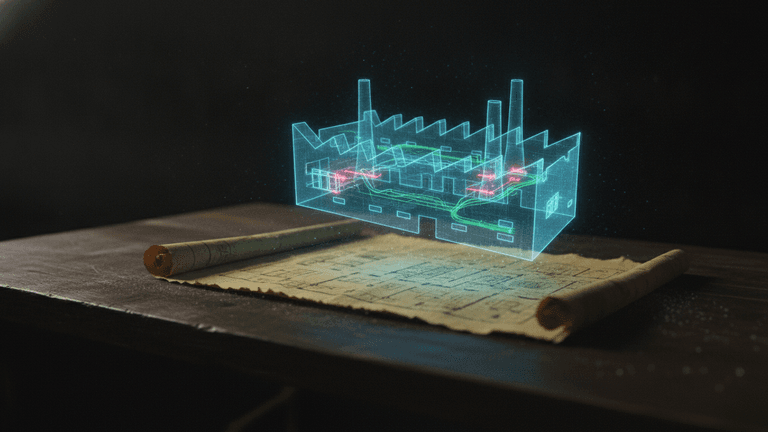
Classic lean manufacturing helped enterprises reduce waste and boost efficiency. Today, digital technologies are taking Lean to the next level, enabling companies not just to fix problems after the fact, but to prevent them before they occur. How digital twins, AI, and real-time analytics are transforming production processes—in this article.
9 min read
Share:
Classic lean manufacturing has proven its effectiveness over recent decades. Lean tools—namely 5S (a system of sorting, order, cleanliness, standardization, and improvement), TPM (Total Productive Maintenance), Value Stream Mapping (VSM), kanban, and just-in-time systems—have helped thousands of enterprises worldwide reduce waste, improve quality, and unlock hidden reserves. But classic Lean has one fundamental limitation: it's reactive. You can map a value stream, but the map reflects the past or present. You can identify waste, but only after it has already occurred. You can tune equipment for maximum efficiency, but you won't know about an impending failure until vibration appears or temperature changes.
Today, reactive lean manufacturing is giving way to proactive lean. Lean 4.0 tools don't replace the classics—they amplify them to the point where they begin working preemptively. A digital twin of an installation lets you see a bottleneck a week before it causes a shutdown. A data-driven maintenance system predicts bearing failure a month in advance. Visual management in the form of heat maps shows not what happened yesterday, but where overload is accumulating right now. What follows is a discussion of precisely this synthesis of Lean and Fourth Industrial Revolution technologies.
What is Lean 4.0? It's not about replacing lean manufacturing with robots and algorithms. It's the integration of Industry 4.0 tools—namely the Internet of Things, big data, artificial intelligence, and digital twins—into classic Lean methodology. The result is a system in which Taiichi Ohno's seven types of waste are detected and eliminated not after the fact, but predictively. Digital technologies transform Lean from a set of periodic audits into a continuously operating mechanism for enterprise self-diagnosis and self-optimization.
From 5S to Digital Workplace Management
The classic 5S system teaches us to sort, maintain order, keep clean, standardize, and improve. The output is an organized workplace where everything has its place and any deviation from the norm is immediately visible to the eye. But there's a problem. At a modern petrochemical plant, an operator manages the process from a central control room, looking at dozens of mimic diagrams and hundreds of indicators. Physical disorder in the workplace has long ceased to be the issue. The problem is digital disorder. Data is fragmented, visualization is outdated, signals drown in noise.
Digital twins and business intelligence systems solve precisely this problem. Modern enterprise business intelligence systems that unite thousands of widgets and tags are the equivalent of the 5S system in the world of data. Each tag is in its place, each widget has a visualization standard, each deviation from the norm is immediately noticeable thanks to color coding. Visualization standards for automated control systems allow operators to stop guessing whether everything is okay. The green zone is working, the red zone requires intervention. It's like a dashboard in a car: if a red indicator lights up, you immediately know where to look rather than randomly checking all the sensors.
Digital 5S should become a mandatory element of any management system. If you can't see the status of all key parameters of your process in real time on one screen with clear color indicators, then your workplace is not organized in the digital sense. And this means that losses of time searching for information, interpreting data, and making decisions under uncertainty are built into your system by design.
Real-Time Value Stream Mapping
Classic Value Stream Mapping, or VSM, is a powerful tool. You take a sheet of paper, walk through the shop floor, stop at each machine, and record processing time, waiting time, and work-in-progress inventory. After a few days, you have a map showing where time is lost and where inventory accumulates. But this map becomes obsolete the moment you finish it. Tomorrow the machine settings might change, the day after a supplier might delay raw materials, and in a week new operators might arrive at the installation.
A digital twin of a process unit, integrated with MES (Manufacturing Execution System) and LIMS (Laboratory Information Management System), provides a value stream map in real time. You don't wait a week to collect data. You see the bottleneck in the same shift when it emerges. An Advanced Process Control (APC) system stabilizes the process, while a Real-Time Optimization (RTO) optimizer continuously recalculates optimal setpoints, preventing parameters from drifting. In advanced projects, the number of manual operator interventions drops several-fold, while unit productivity grows.
But VSM digitalization goes further. Modern digital tools allow you not just to see the flow, but to model its changes. Want to understand what will happen if you increase reactor loading by 3% or change the product grade? A digital twin will answer in minutes, not days of experimentation on real equipment with the risk of defects.
TPM on Steroids: How Digital Twins Predict Failures
Total Productive Maintenance, or TPM, is one of the cornerstones of lean manufacturing. Its goal is to achieve zero downtime, zero defects, and zero accidents. Classical TPM relies on regular inspections, preventive maintenance schedules, and operator involvement in equipment care. But this approach has two fundamental flaws.
The first flaw: calendar-based preventive maintenance is inefficient. You either replace a part too early, wasting its useful life, or too late, risking an emergency shutdown. The second flaw: humans cannot predict failures. They can measure vibration, temperature, and pressure. But they cannot analyze thousands of data points in real time and detect the microscopic changes that precede catastrophe.
Digital twins and predictive analytics systems solve both problems. To make this more concrete, let's imagine an ordinary pump at a factory. Previously, we serviced it on a schedule: once a quarter, a mechanic would inspect it, change the lubricant, and sometimes replace a bearing "just in case." This is like changing your car's oil strictly by the calendar, even if you've only driven a hundred kilometers. Now we have a virtual copy of the pump, trained on historical data. It knows what normal vibration and temperature parameters should look like. When real-world behavior begins to deviate from the virtual baseline, the system issues a warning. Not an hour before failure, but weeks or even months in advance—as if your car sent you a message saying: "Brake pads will wear out in 500 km, schedule a service visit." Maintenance personnel have time to plan the repair, order spare parts, and shut down equipment at a time convenient for production, rather than at three in the morning in response to an emergency alarm.
In projects where such approaches are applied, unplanned downtime has been reduced by 30–40%, while maintenance costs have dropped by 20–25%. And these aren't theoretical figures. Predictive equipment diagnostics systems are already one of the key areas of digital transformation today, alongside neural network technologies and digital twins.
In Russia, Gazprom Neft demonstrates impressive results. Through the application of digital technologies and artificial intelligence, the company generates an additional 500 billion rubles in annual revenue and has achieved a twofold increase in production. Digital twins of fields and processing facilities, integrated into the CyberTEC project, make the industry's economics transparent and manageable. Today, Gazprom Neft extracts more than 60% of its hydrocarbons using artificial intelligence and digital twins of fields.
Heat Maps of Production Systems as a Visual Management 4.0 Tool
Visual management is another powerful Lean tool. Boards with metrics, colored sticky notes, plan execution charts. All of this is fine, but again, it's static or updated once per shift. What if we made visual management dynamic, interactive, and connected to real-time data?
Today, leading enterprises are moving to a qualitatively new level of Lean implementation, deeply integrating it with digital tools. A digital tool—the production system heat map—allows you to see in real time which areas are accumulating problems, where inventory is growing, and where efficiency is falling. Imagine that instead of a dry report, you see a map of the shop floor where problem zones are highlighted in red—just as you see precipitation areas on a weather map.
Heat map technology can be replicated for any type of metric. Red zones on a heat map can indicate areas with maximum downtime, zones with the highest defect rates, or workstations where operators make the most manual interventions. A manager looking at the screen sees not abstract reports, but a clear picture of where to sound the alarm right now. This is visual management 4.0: fast, visual, based on facts rather than feelings.
From Individual Practices to Industry Standards
The experience of leading Russian companies shows that Lean 4.0 works. But so far it works in the format of best practices at individual enterprises. To scale this experience across the entire industry, several systemic challenges must be addressed.
The first challenge. Standardization of visualization. Visualization standards for automated control systems are becoming best practice across holdings. Such standards are needed for each Lean 4.0 tool. What digital 5S should look like. Which metrics must be displayed on a heat map. Which algorithms to use for predictive diagnostics of standard equipment. Without standards, each enterprise will reinvent the wheel, wasting time and money.
The second challenge. Data integration. Most enterprises today have fragmented systems. Process control systems operate on one protocol, MES on another, LIMS lives its own life, and IoT sensors speak a third language. For Lean 4.0 to work at full capacity, these systems must be united into a single digital platform. It's precisely this integration that enables the creation of a system with thousands of widgets and tags that today ensures digital manageability of an enterprise. Gazprom Neft has gone further, developing a national production automation platform that includes digital twin models of oil production processes and an equipment management system.
The third challenge. Data utilization culture. The most sophisticated digital tools are useless if operators and managers don't trust the data or don't know how to interpret it. That's why leading companies pay great attention to training in lean manufacturing and digital technologies. Company programs involve specialists mastering methods for optimizing production processes, working with corporate analytics, and applying neural networks.
Conclusion
Lean Manufacturing 4.0 is not a tribute to fashion or a replacement of classic Lean with trendy terminology. It's an evolution that allows tools invented half a century ago to work in the conditions of modern high-tech industry.
A digital twin of a unit enhances value stream mapping, transforming it from a one-time audit into a continuous process. Predictive analytics systems turn TPM from reactive maintenance into proactive reliability management—as in the example with the pump that now reports its own condition. Integrated dashboards and heat maps give visual management a new quality, namely speed and completeness of information. And standardization of digital visualization, like the classic 5S system, brings order to the world of industrial data.
The main result of implementing Lean 4.0 isn't in beautiful dashboards or fashionable algorithms. The main result is that an enterprise stops reacting to losses and starts anticipating them. It stops guessing when a pump will break down and plans repairs in advance. It stops searching for bottlenecks and sees them on a heat map. It stops wasting operators on endless adjustment of operating modes and delegates this task to advanced process control systems.
Ultimately, Lean 4.0 returns to people what matters most—time to think, time to analyze, time to improve, rather than simply react. And that's its greatest value.